 Photo by Adam Rouse
While we may not always notice or put much thought into space lighting, it’s an important part of a healthy and energy efficient building. For that reason, anyone designing, commissioning, or installing lighting systems needs to be able to describe light sources completely. It’s no secret that engineering depends on good communication (if you think it doesn’t, check out the Gimli Glider or the Mars Climate Orbiter). We can speak about how we want something to work or look, but how do we ensure that the image we have in our head or on paper becomes a reality? As LED technology improves, we need to make sure that the methods we use to communicate LED lighting characteristics, and specifically color rendition, improve as well.
In a previous post, I briefly described what I think are the inadequacies of the Commission Internationale de l’Eclairage’s (CIE) Ra method (more commonly simplified as Color Rendering Index or CRI) for evaluation of color rendition. Here I want to discuss the Illuminating Engineering Society’s (IES) TM-30-18 and shed some light (pun intended) on why I think it is such a positive development.
What’s the difference?
As stated within the memorandum itself, TM-30-18 “describes a method for evaluating light source color rendition that takes an objective and statistical approach, quantifying both overall average properties (color fidelity, gamut area) and hue-specific properties (fidelity, chroma shift, hue shift) of a light source using numerical and graphical techniques”.

TM-30 is calculated based on the spectral power distribution (SPD) of a light source (specifically considering the 380 - 780 nm range).
If we imagine each method (CRI and TM-30) as toolboxes, CRI has one tool. Let’s say it’s a wrench. If all we want to do is tighten a lug nut on our car, it works quite well. But what if we need to change the tire? The wrench only gets us part of the way there. Getting the outcome we want depends on having the right tools. The biggest difference is that TM-30 has more “tools” in its toolbox. Or, leaving that metaphor behind for a second, more ways to describe color rendition characteristics of a light source. So what are the tools in the TM-30 toolbox?
Fidelity Index – Rf
Like I mentioned in my previous post, the CRI method is based on a color rendering index (Ra) alone which describes average color fidelity. A high average color fidelity implies that on average, colors are rendered the same under the test source as they are under a reference source. TM-30 and CRI are similar in that they both include a fidelity index (Ra for CRI and Rf for TM-30), though the calculation method for Rf has been improved over that of Ra.
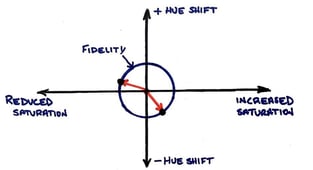
The circle in the image represents a constant Ra or Rf value and the points on that circle represent two different lamps. Despite both lamps having the same Ra or Rf, we can see that their color rendition characteristics are different. Was there a hue shift? More saturated? Less saturated? It’s not that the information provided by a fidelity index isn’t helpful – and sometimes the average deviation is sufficient. But there’s a lot more to the story. So, what else does TM-30 provide?
Gamut Index - Rg
I mentioned that fidelity only indicates the average difference between the source and the reference. TM-30 includes a gamut index, (Rg), which helps address that concern. With Rg, we know how saturated or unsaturated the colors will be. In general, humans find saturated colors (and specifically saturated reds) more pleasing. We see increasing saturation above Rg=100 and decreasing saturation below Rg = 100. Again, sometimes this may be enough information. With fidelity alone, a saturated output could have a low score because it deviates from the reference even if that deviation was a desired increase in saturation. Together, Rf and Rg tell us general information about color rendition and saturation.
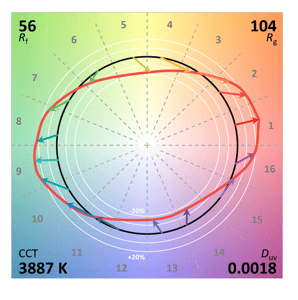
Color Vector Graphics
The last tool I want to mention are color vector graphics. Color vector graphics give us specifics on the rendition characteristics of a source. With a vector graphic, we can see information as it relates to specific hues. The image below (available in the free TM-30-18 Calculation Tool) provides an example of a color vector graphic for a specific light source. If Rg tells us saturation on average, a color vector graphic can tell us which color is increasing in saturation and which colors are decreasing (represented as a shift of the red circle radially away from the black circle). If we have a hue shift, we can see that too (represented as a shift tangentially along the circle).
What’s next for TM-30?
Despite being more descriptive than CRI, the tools above aren’t overly complicated. This is a good thing. It gives us both generalized tools to describe average performance and more specific tools to tune the outcome. In the future I hope the tools described here will be available on product data sheets and TM-30 is more widely adopted. Like with many changes, though, I suspect there will be some CRI inertia to overcome before a complete transition takes place.
It’s sometimes hard to stop during our busy days and observe the spaces around us. The next time you go to your office, job site, studio or workspace take a second in the evening with the lights on to look around. How does it look? Do the colors look pleasing? Studies have shown that filling our spaces with good lighting makes us happier, healthier and more productive. What would you change?
Information presented in this blog was curated from Illuminating Engineering Society (IES) TM-30-18, as well as the Department of Energy “TM-30 Basics” video. For more information on TM-30, check out the memorandum on the IES website and the links provided below. If you have the chance and are interested, download the IES TM-30-18 Lighting Tool as well. The tool includes a library of Spectral Power Distributions for everyone out there (like myself) who doesn’t own a spectrophotometer.