In a previous blog post, I discussed the energy benchmarking service we currently perform for a healthcare network using the Energy Star Portfolio Manager (ESPM) tool. This tool is used to monitor the energy usage of a building over time. It allows a user to set energy goals, compare the overall energy use intensity (EUI) to a baseline year, and compare the building in question to other buildings with similar use-types and characteristics. In addition to continuing this specific service for the healthcare network, Cx Associates uses the benefits of benchmarking in other areas of our work too. This blog post will discuss what other areas of our work utilize benchmarking and then provide a brief update on changes ESPM has made to their scoring metrics over the past year.

Benchmarking Across Cx Associates Work
Retrocommissioning (RCx)
During the qualifying step (phase 1) of the retrocommissioning process, the EUI of the building is developed. This key performance metric allows the RCx Engineer to understand if the building is a high or low energy consumer when compared to similar building types before ever stepping foot into the facility. This is important because it provides an indication as to how much opportunity there will be to reduce energy in the facility. For example, if a building’s EUI is already lower than the national average for similar buildings, it may be an indication that RCx opportunities would be limited and/or difficult to identify.
Burlington 2030 District
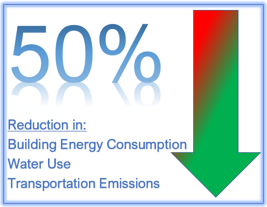
Cx Associates is part of the Burlington 2030 District Engineering Team. This district is a “private/public partnership working to reduce building energy consumption, water use and transportation emissions 50% by 2030”[1]. Among other services, we provide benchmarking and a property energy plan for all Burlington 2030 members who own or lease buildings in the city. In order to reach the 50% energy reduction goal, it’s helpful for our members to know what EUI they should be working towards.
Updates to ENERGY STAR Metrics
Over the past year, Energy Star Portfolio Manager has made updates to their metrics and to their database, both of which had an immediate impact on Energy Star scores. Although we focus mostly on the building EUI (which was not impacted by these updates), the Energy Star score is important to some of our clients who design and build their facilities to meet the certification threshold of 75 points (on a 100-point scale).


Energy Star uses the Commercial Building Energy Consumption Survey (CBECS) to collect data that informs building scoring. In August 2018[2], they updated their scoring to reference the 2012 survey (having previously relied on the 2003 survey). Energy Star should ideally update their scoring every four years – when a new survey comes out. Unfortunately, the 2007 survey was never officially released, resulting in an extended gap between data. Once the new survey data was incorporated, almost every building type saw an overall decrease in their score. While this may not feel like the greatest news for building owners, it means that overall, buildings are getting better when it comes to energy consumption, which is what makes it more difficult for the older buildings to maintain their original (higher) scores.
In July 2019, a change, specific to office buildings, was made to ensure “more equitable” scoring across climates. This change was the introduction of heating degree days (HDD) as part of the score calculation, which increased the scores for some office buildings in colder climates.
The following technical resource has more information about all the recent updates that have been completed in Portfolio Manager after EPA’s review: https://www.energystar.gov/buildings/tools-and-resources/analysis_and_key_findings_epas_review_energy_star_score_model_office_properties
[1] https://www.2030districts.org/burlington
[2] https://portfoliomanager.zendesk.com/hc/en-us/articles/360003530371-Why-are-the-average-score-drops-so-large-for-most-building-types-