Recently, I’ve been getting excited about so-called “no touch” energy audits, which employ meter data analytics to assess a building’s energy performance and even make specific recommendations regarding potential improvements, all without requiring the (expensive) “boots on the ground” of a traditional energy audit. This idea has been getting a lot of attention over the past few years as the increasing availability of 15-minute electric interval data has met with the “big data” revolution. In this post, I’m going to take a quick walk through various analysis techniques, moving from coarser to finer granularity.
From Annual Energy Use…
Do you know how much electricity your building used last year? That’s a pretty easy question to answer, you just need to look at the utility bills over the last twelve months. And with tools like the Energy Star Portfolio Manager, you can even see weather corrected energy use and find out how your energy performance compares to other similar buildings. As I wrote in my last post, benchmarking is a great start for getting a handle on energy usage and can help spur energy improvements. But what if you want to dive a little deeper?
… To Monthly
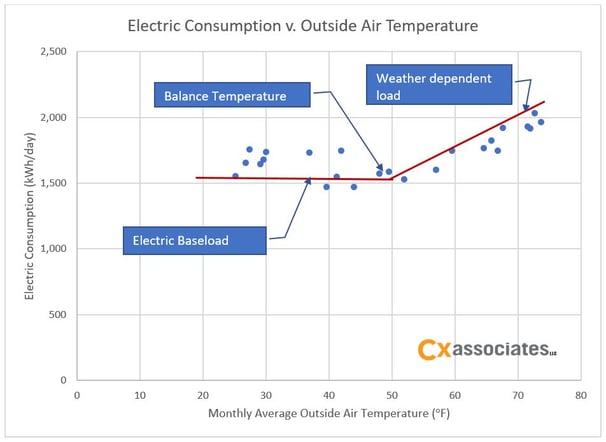
Maybe you’d like to know how much energy the building uses for space cooling. You can get a decent estimate by looking at monthly electric use, and adding up the additional usage above the monthly baseload during the summer months. Something similar can be done to separate out the domestic hot water load from space heating. Weather correction can be incorporated by taking into account heating and cooling degree days. Plotting monthly usage against average outdoor air temperature can reveal the building’s balance temperature, and the steepness of the slope can show how sensitive energy consumption is to weather conditions.
… To 15-Minute
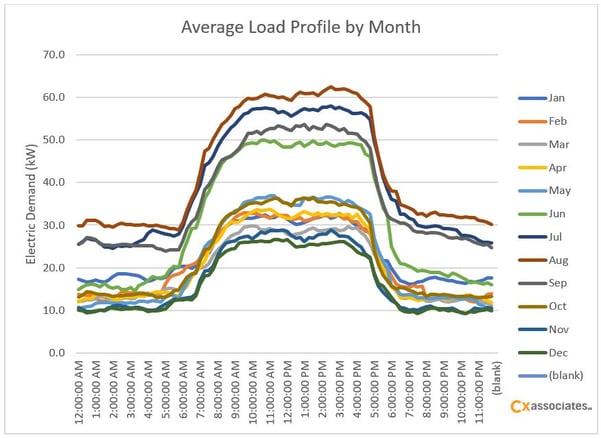
What about energy usage at night when the building is unoccupied? Is the building shutting down when it’s supposed to on weekends and holidays? Is it possible to reduce the monthly peak demand and save on utility demand charges? With 15-minute interval data, these questions can be answered relatively easily using simple analysis tools, and the answers can yield actionable insights. The chart below shows average daily load profiles at a building for each month of the year. It appears the building operates from around 6 a.m. to 6 p.m. Do occupants arrive at the building that early, or might the startup time be pushed back? There is a significant increase in the nighttime baseload during the summer months, along with the peak demand. It is expected that peak demand would increase in the summer due to cooling requirements, but what is going on at night? Is the increase reasonable or is this an opportunity to implement a change in building operation and realize substantial savings?
Beyond Meter Data
While many insights into building performance can be gleaned using 15-minute interval data from a whole building electric meter, the next step is to collect data at an even finer granularity, from the building automation system (BAS) at the equipment level. This data can be used to assess economizer operation, ensure setpoints are being met, identify any deviations from intended control sequences, and even help to detect sensors that are out of calibration. These types of fault detection and diagnostics procedures become very powerful when included as part of an ongoing commissioning program.
I doubt that remotely-acquired meter analytics will ever fully replace the need for experienced engineers to go on site, but these analyses are great for identifying the right questions to ask and for streamlining time in the field, as well as for performing energy assessments at scale across hundreds or thousands of buildings.