For more than a decade, Vermont has been contributing energy efficiency to the New England electricity grid in the Forward Capacity Market (FCM). As a consumer, whether business or residential customer, we think of efficiency improvements as a personal gain, reducing our overhead costs, improving our building’s performance and helping our own pocketbook. Seldom do we think about the impact of energy efficiency on the electric grid, where it actually has a trickle-up impact of our actions onto the bigger picture. But energy efficiency is part of the “supply” for the grid, just like oil, natural gas, solar and other sources. Ben Fowler’s post last month showed a graph of the Generation Fuel Mix of the Philadelphia electric utility. What that doesn’t show is how much is taken off the grid by energy efficiency projects. States take this unrequired energy into account in planning of future energy and infrastructure needs. This has led to avoiding building or expanding substations, transmission lines, and power plants.

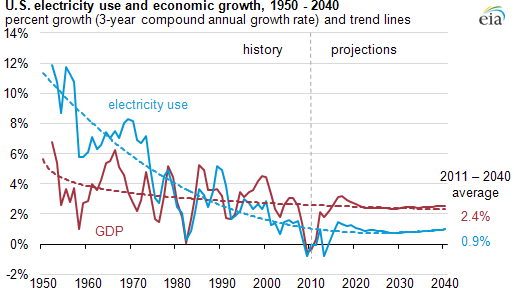
U.S. Electricity Use vs. Economic Growth
For a number of years now, our economy has shown steady growth while use of electricity has decreased sharply. In fact, the US Energy Information Administration expects that the rate of projected growth in electricity use will be less than half the rate of economic growth.

While a significant contributor in the change in electric use from 1950-1980 is due to a decline in the industrial and manufacturing sector, it has continued to decrease significantly due to energy efficiency improvements since that period. As an example, in the Pacific Northwest “over half of the region’s growth in demand for electricity since 1978 has been met with energy efficiency.”
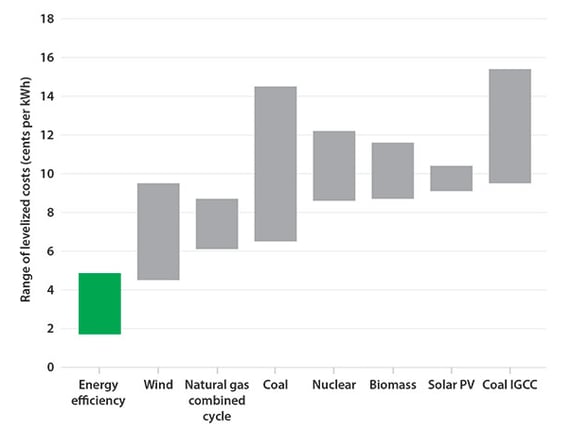
Cost of Energy Efficiency vs. Energy Supply
The reason energy efficiency has been a focus of government and utilities is that Negawatts (avoided energy) is the cheapest source of electricity compared to either existing or new power plants.

At an average of 2.8 cents per kWh, electric utility energy efficiency programs are about one-half to one-third the cost of alternative new electricity resource options. These data represent a large number of diverse jurisdictions across the nation (20 states for electricity programs).
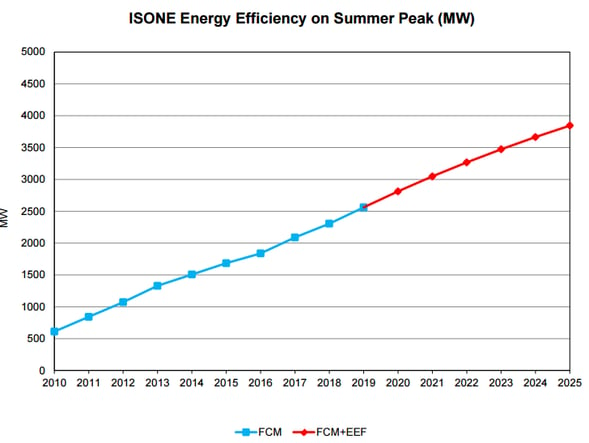
This is especially important in the coming years as a large number of existing power plants are old, inefficient, or cannot meet emissions standards and are therefore slated to be decommissioned. In New England “about 30% of the region’s generating capacity (over 10,000 MW) could be gone by 2020.” These retiring resources are likely to be largely replaced by more natural-gas-fired resources” according to ISO-NE. On the other hand, according to the latest ISO-NE forecast, energy efficient programs could offset most of this lost generating capacity by 2020 (see graph).

This means ISO-NE can defer or reduce the need for building natural gas power plants in the near future and the cost projections for electricity will be considerably lower for many years to come.
Reliability of Savings
It’s easy to determine how much energy is being consumed when the entity is actually using energy. But how do you determine how much isn’t being used when it isn’t there? In 2013 National Renewable Energy Laboratory (NREL) developed protocols for evaluating gross energy savings for each of the most common residential and commercial measures offered through energy efficiency programs. These protocols are used internationally and are the accepted methods for quantifying the impact of energy efficiency measures. Most energy efficiency programs also go through a rigorous Evaluation, Measurement and Verification (EM&V) process where measures are analyzed as to their performance compared to a baseline standard. But that’s a topic for another discussion.


