Renewable energy resources – including solar, wind, geothermal, hydroelectric, biomass (any organic non-fossil material of biological origin), ocean thermal, wave action, and tidal action – are becoming a larger part of the American energy portfolio.
Since the early 2000s, the generating capacity of renewables has been and continues to be grown primarily by wind and solar installations (see Figure 1). In the Energy Information Administration’s Annual Energy Outlook for 2017, the reference case predicts 70 gigawatts (GW) of new wind and solar photovoltaic (PV) capacity to be added for the next five years, encouraged by declining capital costs and the extension of tax credits.
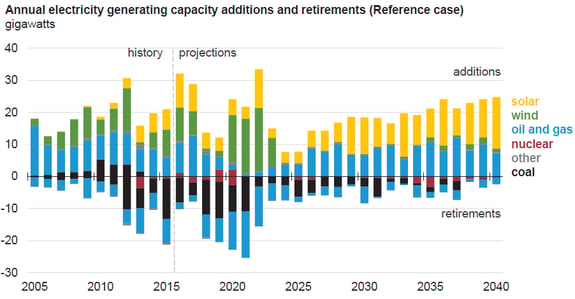
Figure 1: 2005 - 2040 Electricity Generating Capacity of the United States
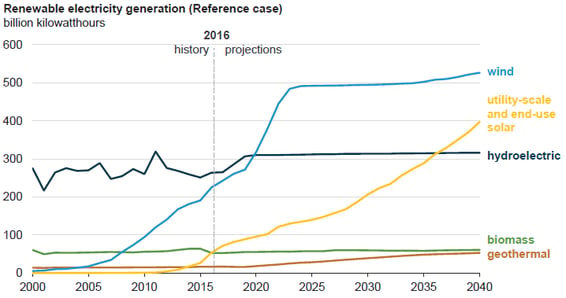
Figure 2: 2000-2040 Renewable Electricity Generation in the United States
In December 2015, Congress passed an omnibus spending bill that included a multiyear extension of the federal Investment Tax Credit (ITC).
Under the legislation, the 30% ITC for solar was extended for three years, ramping down to a permanent 10% credit by 2022. Between 2016 and the end of the decade, the ITC extension will spur nearly 20 GW of additional PV capacity, positioning U.S. solar to remain a double-digit gigawatt annual market through the end of the 2010s.
The large amount of wind development at the beginning of the 2020s (Figure 2) is expected to be deployed to comply with the Clean Power Plan (CPP), which is currently being threatened by the Trump administration. The flurry of projects showcases the rush to build prior to the scheduled expiration of the 1.8-cent production tax credit for wind plants coming online by the end of 2023.
Centralized Plants
Much of U.S. electricity generation occurs in centralized power plants; energy is produced in large, remotely located facilities, and distributed to users in population centers via transmission lines. An interactive map of U.S. power plants, transmission lines, and other energy assets (refineries, fuel storage, etc.) displays the variety of fossil fuel and renewable sources that are used for electricity generation in the U.S., with certain sources predominantly produced in specific regions.
Power production in the U.S. has been operating under a centralized model for the last century for several reasons. The advent of steam turbines allowed plants’ turbines to increase in size while decreasing the cost of electricity, contributing to more favorable economies of scale; these higher-capacity facilities then achieved higher temperatures and pressures, leading to higher energy efficiency. Also, by grouping generators together, individual customers were less affected by outages of specific generators. Innovations in transmission technology enabled electricity to be transmitted over increasing distances, which allowed plants to respond to new environmental concerns about pollution, and move to more remote locations.
However, this centralized system also has large inefficiencies: on a global scale, fossil fuel-sourced power generation results in considerable thermal energy losses (67% of primary energy is lost to heat) and distribution losses (an additional 9% of primary energy is lost through the transmission process). The U.S. Department of Energy’s Monthly Energy Review of national electricity flow for 2015 reported that conversion accounts for losses of 66% of primary energy, while around 5% is lost at the plant and 7% is lost via transmission and distribution. This has led many energy professionals to recommend a concerted effort to move the U.S. towards a more distributed, “smart” grid.
Figure 3 shows the United States’ electricity generation over the past 67 years. Fossil fuel-sourced energy has always comprised, and still currently comprises, the majority of energy produced for electricity in the United States. This does not include energy expended for thermal energy generation from sources like geothermal, solar thermal, or biomass.
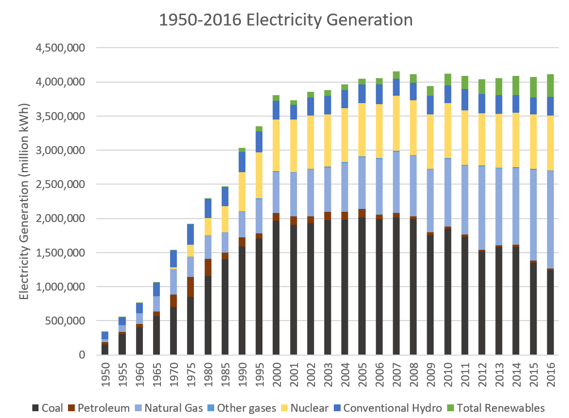 Figure 3: Annual Electricity Generation by Source
Renewable energy sources in the 2010s are generating much more energy than in the 2000s (see Figure 4). Conventional hydroelectric plants are the primary renewable energy source utilized by the United States; the wind and solar technology market has boomed over the past few decades as many states increase their grid’s renewable generating capacity.
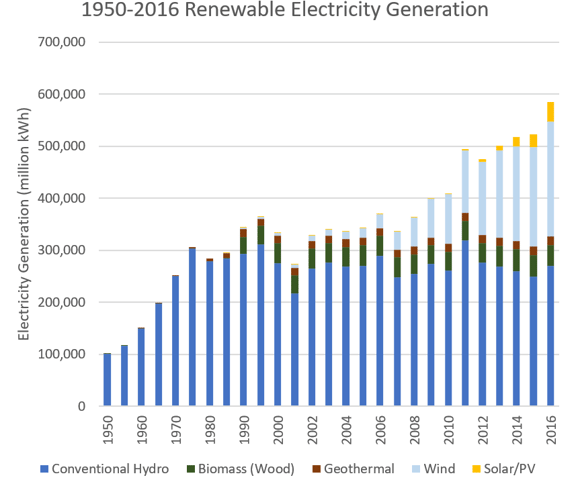 Figure 4: Renewable Electricity Generation by Source
In 2016, power produced from wind turbines amounted to a 40-fold increase over production in 2000. Solar PV experienced even greater increases; 2016 generation was nearly 80 times the solar power generation in 2000.
Figure 5 shows that over the seventeen years that annual data has been produced, renewable energy sources have been accounting for a steadily increasing portion of centralized electricity production.
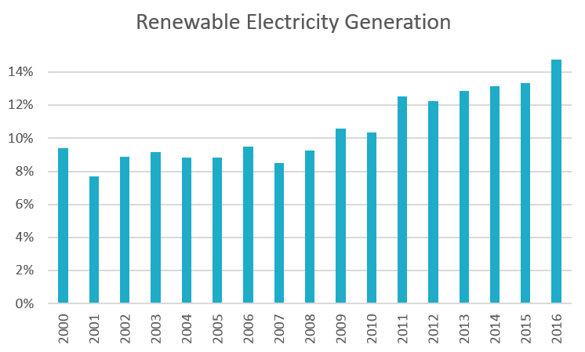 Figure 5: Renewable Energy Portion of Total Electricity Generation
Distributed Generation
Distributed generation refers to energy generation technologies that are co-located with the projects that they serve, either on the project site or near the end user, perhaps at a neighboring community energy facility. Several definitions provide upper limits on the maximum capacity of distributed generators, and some require that generators be connected to the electrical grid (if they are not, they are termed ‘dispersed generation’).
Installed capacity of renewable distributed energy resources (DER) is expected to grow from 109.9 GW in 2015 to 335.8 GW in 2024, representing $1.9 trillion in cumulative investment over the next 10 years. DER have been predicted to grow from $69 billion in market value in 2012 to nearly $86 billion in 2017.
A Utility Dive survey of electric utility professionals found that the U.S. power mix is undergoing a “profound shift” due to environmental regulations on greenhouse gases (GHGs), renewable energy incentives at the state and federal level, steady price declines in natural gas and renewable technology, and growing consumer demand for clean energy.
Figure 6 shows that PV panels are the DER of choice for building projects, and installations are projected to increase steadily due to continued decreases in system price and sustained tax incentives.
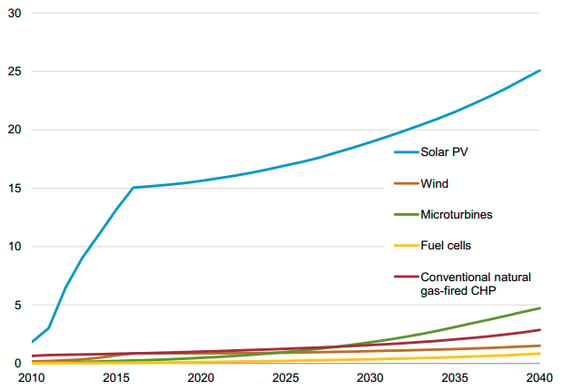
Figure 6: Projected Installed Buildings Sector Distributed Generation Capacity, (GW) in the 2013 Annual Energy Outlook Reference Case
State of the U.S. Solar Industry
The solar industry has experienced over a decade of substantial growth due to lowered system costs, higher efficiency ratings, and favorable financial incentives through federal tax credits. In 2016, the cost to install solar power generation systems of all kinds decreased by 15-20% (see Figure 7). Since the 2006 expansion of the Business Energy Investment Tax Credit, solar installations have been eligible to receive credit for 30% of system costs, enabling solar companies to invest in and proliferate solar technology while at the same time reducing system prices for consumers.
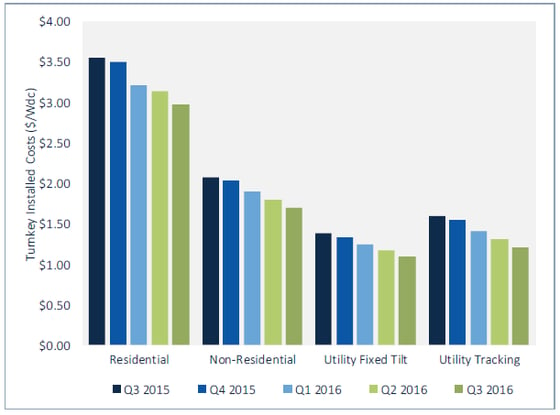
Figure 7: Modeled U.S. National Average PV System Costs by Market Segment
Figure 8 shows the installations from the different segments of the PV market over the past four years. The residential market has seen steady growth without much cyclical or seasonal behavior while the non-residential segment has experienced modest gains. The utility sector can be volatile and generally experiences a boom in the fourth quarter, as commercial installations strive to complete construction by the end of the fiscal year.
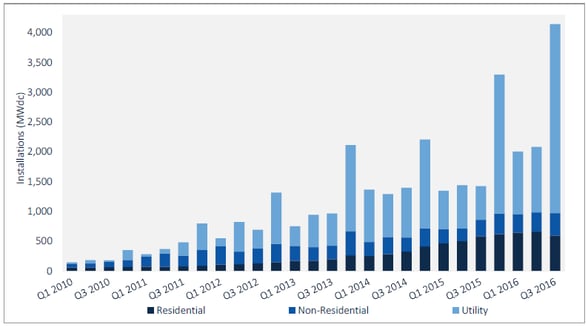
Figure 8: U.S. PV Installations by Market Segment
Continuing its growth streak, the U.S. installed 4,143 MW of solar PV in Q3 2016, increasing 99% over Q2 2016 and 191% over Q3 2015. This marked the largest quarter ever for the U.S. solar industry.