Hi, it’s me again – two blog posts in a row! I still haven’t had the time to compile the full TMY3 comparison picture that I envisioned when I started this rant. (See my last post if you want to learn the TMY3 basics.)
Given the challenges with hourly data compilation, I decided to focus on heating degree days (HDD) instead. We have been compiling heating degree days, with the help of John Quiney of the Vermont Consumers Energy Cooperative to develop the awards analysis for the Vermont Green Building Network’s Greenest Building Awards. So, I had a ready source of historic Vermont HDD data.
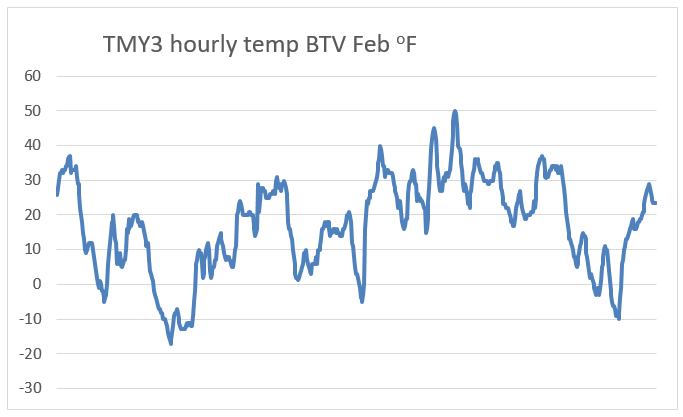
My next step was to calculate the HDDs in the TMY3 data for Burlington, VT. HDD is defined as 65 degrees F minus the daily average temperature (defined as average between daily max and daily min temp).
![]()
The annual HDD is the sum of the year’s daily HDD.
Based on the 14-year average of heating degree day data for Burlington, Vermont, using TMY3 data is not unreasonable for calculating current year impacts of energy efficiency measures. As we can see in Figure 1 actual HDD values have been hovering close to the TMY3 value of 7,071 HDD per year.
Figure 1.
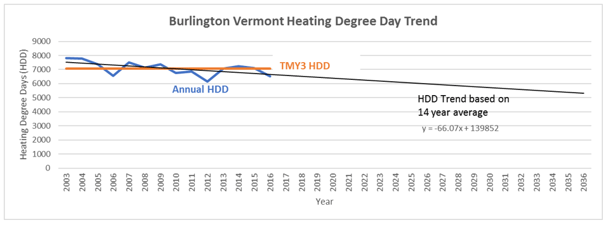
But, as we look at the more recent years, we begin to see the trend of the HDDs decreasing. The following table compares the recent HDD averages to TMY3.
Table 1.
| Period | HDD |
| TMY3 | 7,071 |
| 2003-2016 | 7,084 |
| 2007-2016 | 6.968 |
| 2011-2016 | 6,812 |
The question we need to be asking is: “should we continue to use TMY3 data to estimate future energy savings from temperature dependent measures?”
My preference would be to develop impact estimates using hourly or even bin data, I don’t have that data at my fingertips for this analysis and I must get back to my projects, so I’ve taken the HDD shortcut. I’m assuming in this analysis that the ratio of HDDs is representative of the ratio of temperature dependent heating savings. In Table 2 I’m showing the ratio of TMY3 HDD to the average of the projected HDD over the measure life. The projected HDD are calculated based on the trend line Figure 1.
Table 2.
| Measure Type | Measure Life | Heating Savings Overestimate |
| Air Source Heat Pump | 13 | 114% |
| Boiler | 20 | 119% |
| Building Envelope | 30 | 126% |
This is of course only half the story. As heating degree days diminish, cooling degree days are increasing. That means not only are we overestimating heating savings, we are also underestimating cooling savings. As an industry, we need to find a way to address this. I suggest that rather than using TMY3 for savings normalization, we should develop the trends for the area we are studying and calculate the projected future temperatures over the measure life.
My real desire is to look at hourly temperatures over a typical meteorological year and compare that to the hourly data for recent years. I don’t have the bandwidth to compile all of that NOAA data. If you have the time or interest, please send me your analysis, I’d love to get an industry conversation going on this issue.