
Similar to other domains, data from buildings is being generated at an unprecedented pace and scale. However, all of that data is useless if we can’t extract meaning to create value and yield actionable insights. This requires the utilization of protocols or standards to effectively make sense of the data. Project Haystack is one such standard that has been developed over the past several years and allows for the contextual tagging of data in a flexible way, using data from any number of sources.
How does Project Haystack work?
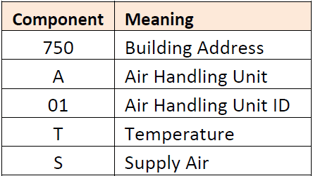
Imagine there is a sensor in a building that is measuring the supply air temperature of a particular air handling unit. Perhaps the point is labeled in the building automation system (BAS) as “750.A01TS”. This label is a bit cryptic, but based on our prior experience, best engineering judgement, or discussion with the facility engineer we can parse the string and may be able to identify the following mapping.
Instead of struggling to garner meaning from a flat text string that a controls contractor may have chosen as a point ID, we can use the Haystack tagging conventions to simply apply the following tags to this data point and arrive at a complete description:
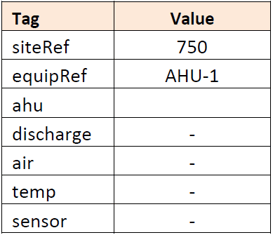
In this case, a couple of the tags have associated values (“siteRef” and “equipRef”) while others are simply “markers” that define characteristics of the data point.
What if we want data from a point that is not being monitored by the BAS?
We can always install our own logger to grab the data, tag it appropriately, and feed it into our data model. In this way, the tagging metadata can be used to create a new layer of data description on top of any existing layers. The beauty of this type of system is that data from multiple sources can all be combined into one integrated model for analysis. For example, the model can contain data from electric meters, different BAS types, stand-alone data loggers, and various internet-of-things (IoT) devices.
Of course, it can be labor intensive to manually tag all of the data after the fact. A better scenario would be one in which everything is tagged appropriately from the beginning, but this involves buy-in from many different stakeholders across the building industry. We are making progress on this front, but still have a ways to go. In the meantime, there are various methods to help automate the tagging and data model creation.
What else is out there to help us understand building data?
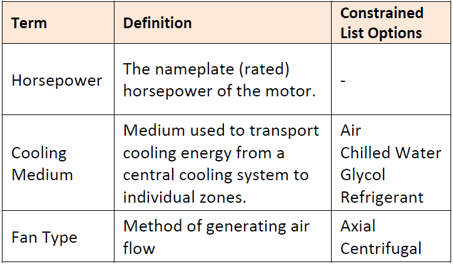
Another standard being developed around building data is the Building Energy Data Exchange Specification (BEDES), which attempts to define any term that may be used in a building performance project such as an energy audit or campus portfolio benchmarking. The table below shows a sampling of these terms. Many of the definitions utilize constrained lists to standardize the data input.
There are many use cases for standardized data modeling in the building energy world, including:
- Ongoing commissioning
- Retrocommissioning
- New-building commissioning
- Energy audits
- Portfolio analysis and benchmarking
- Load profile development
- Grid management
- Energy efficiency program development
How are we, at Cx Associates, currently using these tools?
We have recently begun experimenting with combining the Haystack standard with BEDES definitions to help streamline and standardize our building energy audit process.  After creating our building data model that defines equipment, zones, and relationships between them (e.g. this zone is serve by this VAV box which is supplied by this air handling unit, which is served by this chiller), we can then use the model to extract whatever data we want. We can supplement the Haystack tags with as many additional tags as we need in key/value pairs to define all of the characteristics of the equipment in the building, such as motor horsepower, boiler efficiency, chiller manufacturer, pump design flow, etc. Then we can create queries to return customized tables or forms we want to include in a report. Or easily add up all of the AHU supply motor horsepower values for use in a savings estimate calculation. The possibilities are many.
All of this data is obviously useful for optimizing the operation of individual buildings, but its real power may come from aggregation across tens, hundreds, or even thousands of building. We are just beginning to scratch the surface. In a future post, I will present a more concrete case study using building data.