Recently, while reviewing the controls strategy for a large building’s condenser water pumps, I came across something I wanted to share – a simple opportunity for efficiency with no first cost. One, in fact, that increased pumping efficiency by 16% for a large portion of the annual operating hours. To find this opportunity, we considered the off-peak performance of the pumping system, not just its ability to meet peak loads.
Background
This system was comprised of one 1500 GPM pump (called P-1) to handle the peak load of the building and a smaller, 500 GPM pump for off-peak loads (called P-2). The design head or pressure requirement at 500 GPM was 100 ft of water and the pumps operate all the time, 8760 hours per year, to support the building’s operation. The system was expected to operate at or near a load of 500 GPM for a large portion of that time, roughly 1/2 the operating hours of the system. The larger capacity pump was only necessary for times when the load exceeds 500 GPM1.
The engineer’s sequence of operations said to start with P-2 as the main pump and if P-2 reached 85% speed (425 GPM), bring on P-1 and stop P-2. It wasn’t clear where the 85% threshold came from and it turns out that it was, basically, a random choice not based on operational requirements or expected efficiency. But the premise was good – keep things slow and you’ll use less energy.
Recognizing the Potential
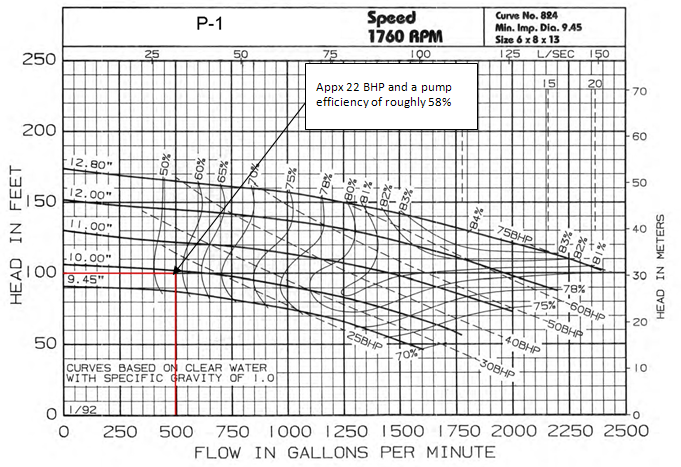
As part of our design review scope, I reviewed the project’s sequence of operations. At first glance, the 85% speed limit on P-2 seemed fine, or at least nothing of concern. I then thought about the fact that the system was expected to operate in the 425 – 500 GPM range for a large portion of the time and decided to see if there might be an opportunity there. I know from looking at pump curves that, typically, pump efficiency decreases at reduced flow rates, provided the pump was selected at a reasonably efficient peak load operating point. This brought into question the use of P-1, the 1500 GPM pump, starting at a 425 GPM load. When looking at the pump curves for P-1 and P-2 at 500 GPM and 100 FT of head, the pump efficiencies were significantly different, 75% for P-2 but only 58% for P-12. Since pump efficiency is essentially the measure of how effectively a pump turns electrical energy into useful work, that represented a 16% potential reduction in electrical energy used for a fair portion of the pumps’ operating hours.
Finding the Information
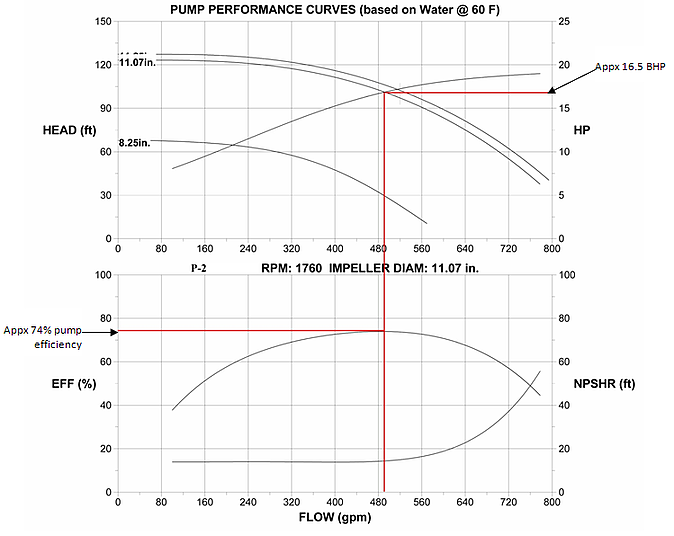
I’ve seen two basic forms of pump curves, one I’ll call the “catalog curve” which is what you’ll find if you look at an old pump catalog. Yes, some time ago, manufacturers published books of curves, three for each pump actually (1200, 1800 and 3600 nominal RPM), which is why I chose that term. You can now find these curves as PDFs on most manufacturers’ websites. The other I’ll call the “selection curve” which is the curve generated by the manufacturer for your specific operating condition. You can generate these curves yourself with pump selection software that is usually freely distributed by pump manufacturers. The key is that either format gives you two important pieces of information – the pump efficiency and the pump’s operating horse power or brake horsepower (BHP) at the design condition.
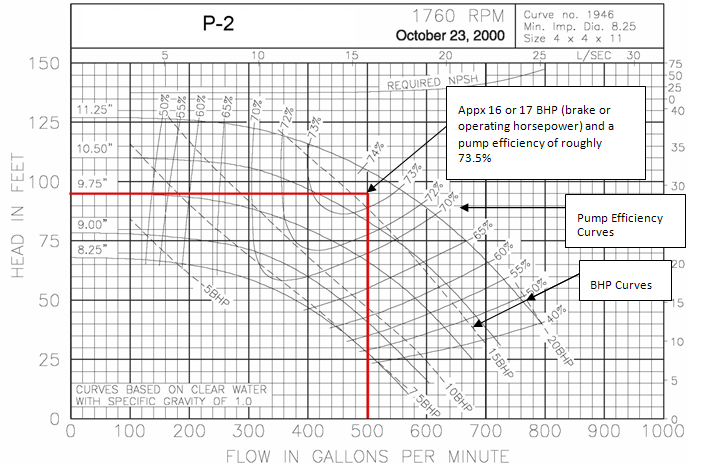
Following are both the catalog and selection curves for P-2 to provide an example of how the same information might be conveyed differently. The same data is also typically provided in tabular format in the equipment submittals.
Identifying the Opportunity
For this exercise, as noted above, I compared the catalog curves for P-1 and P-2 to one another. Any way you slice it, the most important piece of data to look for is the BHP at the same operating conditions. That’s the apples-to-apples comparison that shows you what the potential energy savings is.
Here’s the catalog curve for P-1 (the larger pump) at the 500 GPM operating point.
As you can see in Fig 1, at 500 GPM P-2 consumed roughly 17 BHP and as seen in Fig 3, P-1 consumed roughly 22 BHP at exactly the same operating conditions. That’s a 5 BHP difference for 4,400 hours of operation. 5 BHP = 3.73 kW which translated into an annual savings of 16,500 kWh. In my region, a blended electric rate (one that considers both kWh and kW charges) is generally around $0.12 per kWh. That’s an annual energy savings of about $1,980. OK, not a whopping huge savings but it was FREE! No change of equipment or components was required – just a simple tweak to the control sequences of operation that hadn’t even been programmed yet. The solution was to let P-2 run up to 100% and only bring P-1 on line if the pump’s pressure set point wasn’t being met.
Most mechanical engineers are trained to design and specify systems that are able to meet the peak building loads, which is of course critical. But our buildings spend the majority of the year operating at much lower loads and many times equipment operates at lower efficiencies during those hours. This is just one example of the many hidden efficiency opportunities that exist when systems and equipment are looked at holistically, not just to ensure peak load performance. Equipment is willing to operate efficiently, if we let it. A second thoughtful look at control strategies and some critical thinking can open opportunities so that unnecessary energy consumption, as well as equipment maintenance costs, are minimized and equipment life is maximized. Not bad for no first cost!
References:
1 Another option would have been four, 500 GPM pumps which would simplify the control somewhat, add redundancy, increase operating efficiency and standardize the pumps’ spare parts and maintenance requirements without sacrificing performance.
2 The efficiencies are nearly the same at 85% speed or 425 GPM as they are at 100% speed or 500 GPM.


