How much greenhouse gas is in our electricity? This question isn’t just academic for those of us working to decarbonize buildings. In applications that use some combination of fossil fuel and electricity—which is common!—controls strategies for decarbonization depend on being able to make GHG comparisons between fossil fuels and electricity. These scenarios play out in day-to-day commissioning work.
I’ve taken on the development of a control sequence for a rooftop air handling unit serving operating rooms at a hospital. The control sequence should introduce the optimal amount of outdoor air at every instant. Because operating rooms are densely occupied, use lots of equipment, are windowless, and lie in the interiors of well-heated hospitals, they generally require year-round cooling (even in New England!). This introduces an opportunity to save electrical energy with “free cooling”: rather than running mechanical cooling, we can use the rooftop unit’s economizer to bring in cold winter air. Sounds like an easy win.
But of course, it’s never that easy! Operating rooms also have very particular relative humidity requirements. Cold outdoor air is usually dry, and as it warms up, its relative humidity drops even further. If we bring in cold outdoor air, we then have to run the humidifiers, which use fuel; their job is to boil water and vaporize it into the airstream.
So now we have pitted electrical energy efficiency against a fossil fuel trade-off. Do we run the mechanical cooling on electricity, or do we run free cooling with the oil-burning humidifier? Which is less carbon-intensive, and at what points in time?
Using widely available GHG emissions rates for fossil fuel combustion, I can easily get an emissions factor per unit of humidification. But emissions rates for electricity are less straightforward. How do you trace a kilowatt-hour backwards through the poles and wires to determine its carbon footprint?
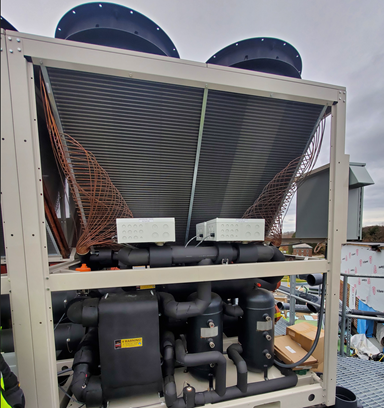 A rooftop chiller. How much it runs depends on how we choose to control it. If we reduce run hours on the chiller, are we just causing the humidifier to run more?
It turns out that determining the benefits of avoided electric supply is of great interest to utilities, regulators, and electricity generators. In this world, the carbon footprint of avoided electrical end-uses is calculated using marginal emissions rates. Marginal emissions come from electricity generators that are physically scaling up or down with demand at any point in time (rather than serving as constant baseload). The idea is that somewhere, regardless of your utility’s long-term contracted renewable energy purchases serving the electric base load, there is a marginal generator (a natural gas turbine, for example) running “trim,” ramping up or down to balance the grid depending on system demand at that moment. So, when you shut off your air conditioner and open up the economizer, that marginal generator gets to ramp down their supply. Maybe you give them a friendly wave from behind the meter and say, “I did that!”
There are various ways to account for marginal emissions, but here is a straightforward table of the next years’ worth of marginal emissions rates for New England, according to the 2021 Avoided Electric Supply Cost study published by Synapse Energy Economics:
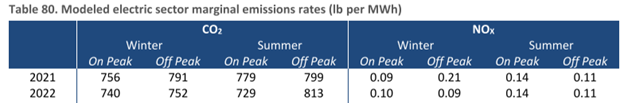
Even though I used a gas turbine as the example, marginal generators are not always fossil-fuel fired. The factors in the table above likely represent a blend of mostly natural gas and some renewable energy. The factors are the result of the authors’ extensive modeling to compare a future of energy efficiency and demand management vs. a future of business-as-usual. Electric supply is so complex that modeling is the only way to determine these if/then scenarios, and the results are best applied for only one year at a time.
For time frames beyond the next year or so, the AESC Report recommends using “long-run marginal emissions rates.” Long-run rates scale the marginal emissions factors down by some percentage that corresponds to the projected adoption of renewable generation onto the electric grid, depending on what New England state you’re in. This way, we’re accounting for the case where instead of causing a gas turbine ramp down with our efficiency measure, we’re instead incrementally downsizing a renewable build. By including renewables in long-run marginal emissions rates, we’re ensuring that we don’t over-state GHG savings. (If you live in New England, check out your state’s projected percentage adoption of renewables in this ISO New England report).
For the hospital seeking to decarbonize their operations, the result of accounting for these renewable energy fractions in marginal emissions is that for years beyond the first year of installation, free cooling + fossil-fuel-based humidification looks incrementally less compelling than keeping the damper closed and running the cooling coil. In a hypothetical world where all the electricity on the grid comes from carbon-free generation, then my control strategy would be simple: keep the outdoor air damper closed as much as possible (down to a 20% minimum in this case) and run the mechanical cooling as much as possible. But, although many electric utilities in New England should be commended for balancing their supply portfolios to be carbon-neutral on the year, we are a long way from the world of 24/7 zero-carbon electric supply. For the time being, the right answer will continue to be some balance of the mechanical cooling and the dehumidifier.
While it may not translate well into a final control strategy, this emissions accounting guidance from the AESC Report gives me a straight-faced method to calculate the 20-year GHG impacts and savings of the control strategy we finally choose to implement, and to estimate these impacts and savings for the building owner. The method includes considerations for marginal generators as well as renewable energy being added to the grid, which sits well with my understanding that electrification is a key pathway to a low-carbon future.
Side note: one way the long-run marginal method falls short is in accounting for peak times. The method cuts the year into only 4 categories: summer and winter on-and off-peak times (see graphic above). I know that times of extreme heat or cold stress the grid, as well as times of pervasive high occupancy. ISO New England’s Emissions Report published last year shows marginal emissions for the top five high electric demand days (HEDD) to be nearly 25% more carbon-intensive than year-round average marginal emissions, while the values in the marginal emissions table vary by much less than 25%. On those high electric demand days, will our rooftop unit be hurting or helping?
For those of us developing controls strategies for HVAC equipment for clients who care about decarbonizing, the ideal case would be if utilities provided real-time, locational-marginal emissions factors. I could then use those factors as input variables for controls strategies, just like outdoor air temperature, humidity, and other measurable quantities. Until then, I’ll make my best assumptions, and when the next AESC report comes out, I’ll evaluate how we did in retrospect.