There are two ways to operate a building: passively or actively. Operating passively means the building performs its intended function – the lights are on and the building is temperate – but no one is monitoring and analyzing the operating costs or planning for equipment issues. Actively operating a building involves close monitoring of the building operating costs, thoughtful maintenance of building systems and their operating schedules, and capital planning for future equipment replacements. There is a new (relatively inexpensive) tool emerging on the market that can help both of these types of building managers move toward simple, effective, and knowledgeable operating oversight.
A Picture is Worth a Thousand Words

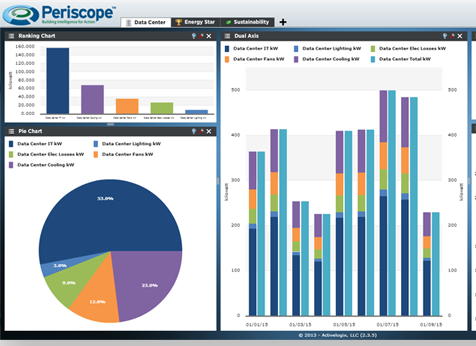
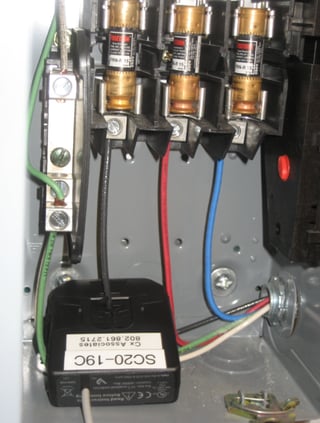
A number of energy services companies have power monitoring hardware with a user-friendly data analytics and visualization software platform that enables visualization of how a building uses energy. Data on electric consumption is collected either through the installation of current transformers[1] (CTs) on building’s electrical system or through the existing building automation system (BAS).
The software is designed to provide visualization of the energy consumption in hourly, daily, monthly, and annual time periods. This allows you to quickly look at the profile of your energy consumption. For example, a graph of the lighting loads of the building will show you if the lights are turned off during unoccupied hours or if the operating schedule provides an opportunity for energy savings. Data of the air handling units can inform you if the unit is operating in constant speed mode, requiring conditioning of air 24/7, or is varying its operation with the load and schedule of the building. In other words, just a simple analysis of the graphs of lighting, plug loads, data center, air handling equipment, pumps, plug loads, etc. can quickly inform you of the largest loads in the building and the opportunities for efficiency gains.
Even for buildings where the facilities staff interacts with the current BAS, this type of interface is proving to be a very useful tool in communicating the status of the building operations, opportunities for improvements, and quantification of realized savings attributable to implemented measures.
What’s Involved to Get Improved Building Data Analytics?

For end uses without a BAS, the monitoring system entails installing CTs on the circuits you want to measure. This could be the main building lighting circuit or could be as small as your office’s server. For end use points that are on the BAS - such as air handlers, pumps and chiller - the software can usually read their output directly.
Determining what to meter is critical, as you want to get a comprehensive picture of the end use. For example, you want to capture all of the lighting circuits (which may be a number of them spread out over your facility) so that you can analyze the full profile[2] of its operation. You also want to make sure you capture the largest loads, which may be a certain process or the data center, so you can prioritize your investigation of savings opportunities.
Opening the Building Data Analytics Doors to the Masses
Typically, the tool does not actually control the BAS, but “Leverages analytics and data visualization to identify savings opportunities and to catch savings erosion”; in other words, it will provide you information as to where there are opportunities to save on your energy costs. Monitoring the graphs over time will also inform you when things start changing. If equipment is operating inefficiently (a belt is coming loose), you will be able to see it in the comparison of the graph over time.
In our commissioning and retro-commissioning work we have come across buildings where components do not communicate well with each other. Even with a BAS, systems can be fighting each other (simultaneous heating and cooling) or setpoints (water and air temperatures and pressure) are far off the mark. And, even with a BAS, building operators are often not aware of the situation because the system does not have a user-friendly interface. It is very difficult and/or time-consuming for someone to figure out the individual system control sequences, let alone determine if they are correct. This new data analytics and visualization software however, makes the building characteristics accessible to even an inexperienced building owner or an over-worked facilities manager.
[1] CTs are devices required to measure the flow of electricity being consumed by a building or any of its loads.
[2] A load profile, or load shape, is the curve that represents load as a function of time. The load changes with time in response to changes in lighting levels; heating, ventilating, and air conditioning (HVAC) requirements; and end uses such as computers, copy machines, and so on.


