Investments in energy efficiency are often evaluated in terms of their relative financial performance. In the realm of building energy efficiency, the relative financial performance of investment alternatives is typically quantified in terms of a simple payback. Simple payback calculations may be helpful for initial screening and ranking of project alternatives, however, they can oversimplify financial evaluation to the point that the best performing alternatives are not properly quantified and identified. Life Cycle Cost (LCC) analyses, in comparison, include a comprehensive examination of all of the costs and savings attributable to the investment.
 Investment (Photo credit: LendingMemo)
The Simplicity of Simple Payback
A simple payback is simply an estimate of the number of years to recoup a capital cost investment, without consideration of the time value of money (i.e., financial interest rates) or other less-tangible impacts of the investment. In energy efficiency project evaluation, a simple payback is calculated as the incremental capital cost of a project divided by the incremental savings of the project. Typically, only the energy savings of the project are considered and relative costs/savings of other operating and maintenance activities are not accounted for.
![]()
Life Cycle Cost Analysis
The recent “Life Cycle Costing of Intelligent Buildings” report describes and advocates for the use of life cycle costing to evaluate investments in building energy efficiency. According to this report,
“LCC [life cycle costing] is often substituted by simple payback analysis and other capital cost justification methods to meet the same objective. . . . Such substitute approaches may not lead to a complete amalgamation of all necessary elements such as first costs, training costs, operation and maintenance (O&M) costs, service agreement costs, upgrade/retrofit costs, and disposal/deconstruction costs, and does not enable involved parties to understand the true ROI. . . . recurring savings and incentives that could accrue beyond initial years have an impact on total cost of ownership, which can be better judged by a complete LCC analysis, as opposed to a simple payback analysis.”
Comparison of LCC and Simple Payback
Perhaps the best way to explain the limitations of simple payback and the superiority of life cycle costing is to provide a basic example. Table 1 below shows example capital, energy, and maintenance costs for lighting investment alternatives. The lighting alternatives include the existing lighting (the “do nothing” alternative), high efficiency fluorescent lighting, and LED lighting. The LED lighting has the highest capital cost, but also provides the highest annual energy cost savings and maintenance cost savings relative to the existing lighting.
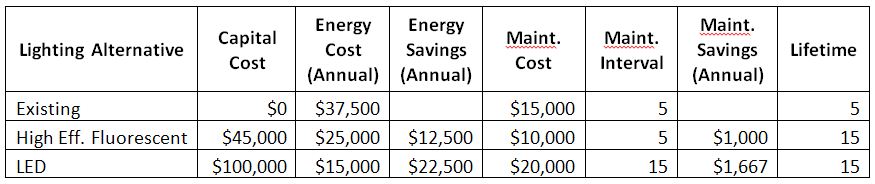 Table 1: Example Capital Costs, Energy Costs, and Maintenance Costs for Lighting Investment Alternatives
So how do the investment alternatives compare via simple payback vs. LCC? Table 2 presents the simple payback, life cycle costs, and total savings for the example lighting investment alternatives. The simple payback indicates that the high efficiency fluorescent lighting alternative is preferable, even if we account for both the energy cost savings and maintenance cost savings. However, over the 15-year life cycle of the lighting investment, the LED lighting alternative offers a lower LCC total cost. Thus, even though the LED lighting alternative has a longer payback period, the LED lighting alternative provides substantially greater savings relative to the high efficiency fluorescent alternative over the lifetime of the investment[1].
 LED spotlight using 38 individual diodes for powering from mains voltage (Photo credit: Wikipedia)
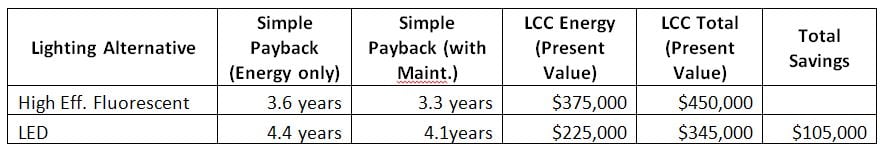 Table 2: Simple Payback, Life Cycle Costs, and Total Savings for Lighting Investment Alternatives (0% interest rate)
Table 2 illustrates the cumulative 15 year cash flows for the example lighting investment alternatives. We can see that the high efficiency fluorescent lighting alternative breaks-even before the LED lighting alternative (3.3 years versus 4.1 years), and that the LED lighting alternative accrues a higher total savings ($105,000 more than high efficiency fluorescent lighting).
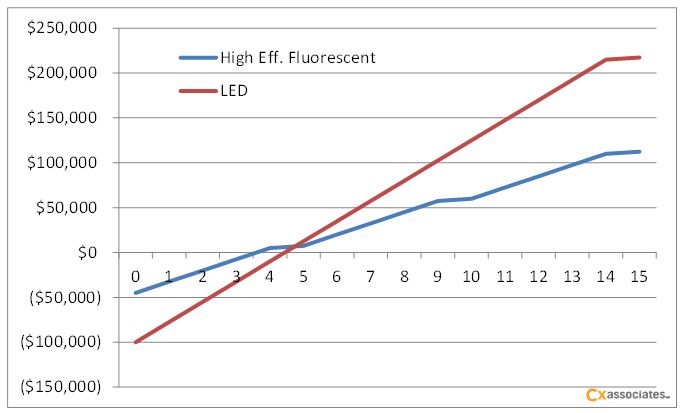 Figure 1: Cumulative 15 year cash flows for example lighting investment alternatives.
Life cycle costing is not yet the industry norm for evaluating energy efficiency investments. Nevertheless, when building owners and managers are able to see that LCC provides a better quantification of the financial performance of investments, LCC can have a positive impact on both financial return on investment and energy savings.