Cx Associates now offers an Energy Management and Information System (EMIS). We’ve built a set of customizable dashboards to serve up energy insights, fault diagnostics, and utility-grade cost savings in a browser-based platform. And we’re ready to get yours launched.
What differentiates our EMIS from the rest is the Cx Associates team’s decades of expertise in building mechanical systems. If you’ve worked with us, you know we are complete building science nerds. On Tuesday, I’ll have my head inside an air handling unit, and then on Wednesday I’ll be running an energy model in OpenStudio. We work with trade partners, technicians, engineers, and building owners, and our role requires code-switching across dialects. We understand buildings, and we understand what building owners want to see in building performance. This is why you want an EMIS built by commissioning agents and energy analysts!
Why do you need an EMIS?
But you’re already swimming in data? Well, then you need an EMIS even more! Our objective is to distill all that data into actionable insights and visualizations that make sense to you.
A little disambiguation. Many buildings already have a BMS or BAS – Building Management or Building Automation Systems, respectively. This is different than our EMIS. BMS and BAS systems (screenshot below) are fantastic tools used by controls contractors and engineers to monitor the various components of your building. With a BMS, someone with adequate permissions can log in and make changes to control sequences, implement overrides for testing or new equipment installation, or even troubleshoot component-level problems.
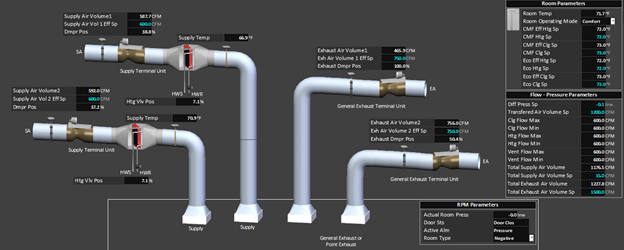
An example of a BMS graphic showing supply and exhaust ventilation to a single room.
An EMIS, on the other hand, takes a higher-level perspective, synthesizing data into system-wide insights. Here's a list of examples of insights our EMIS will tell you that a BMS won’t:
- How is my energy consumption doing this year compared to last year this time? (Hint: we will weather-normalize the data for you in real time!)
- How much money and/or energy are my new heat pumps saving?
- Right now, how does my building’s Energy Usage Intensity (EUI, or energy used per unit area (kWh/ft2 or MMBtu/ft2) compare to other buildings like mine in New England? In the U.S. or across the world?
- Which building on my campus has the highest EUI? The lowest?
- If I ask my facilities engineer to change the occupancy schedule tonight, will this save energy tomorrow?
- Is my building on track to meet our decarbonization goals?
Rather than doing all this data wrangling and analysis yourself, let our EMIS do it. We set these indicators and metrics up to be delivered to you 24/7 in a dashboard. If this sounds great – we think so too! Deploying an EMIS ultimately makes your building easier for us to commission or retrocommission as well.
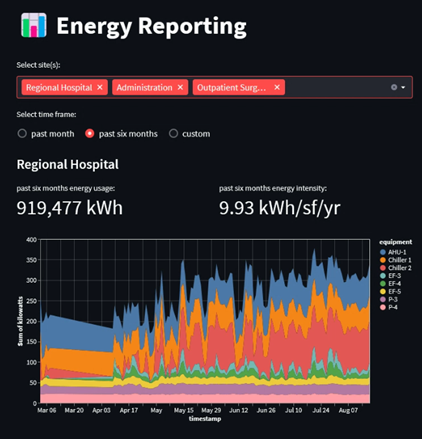
A screenshot of one of our EMIS plots showing a (demo) hospital’s energy consumption over time. The total is the sum of energy consumption of individual equipment, which are shown in the key on the right.
In addition to energy performance metrics, our EMIS also offers more advanced Fault Detection and Diagnostics (FDD). Yes, your BMS should throw an error if there are component-level faults like sensor failures or stuck valves (to the best of its knowledge!), but it probably won’t be able to synthesize component-level signals into larger system-level indicators. Our team of building experts has spent years developing and refining best practices in monitoring-based commissioning (MBCx). Here are some examples of things our FDD reporting looks for:
- If a heating valve is closed, the delta T across its heating coil should be near zero. If not, the valve might be faulty or leaking, leading to wasted cooling energy in the summer. This may be worth a service ticket.
- Are the heating, cooling, and economizer (outdoor air damper) functions of your air handling units all working in concert, according to the building schedules and outdoor air enthalpy and temperature? If not, how much energy could you save by restoring their sequences to their original intent?
If that last one sounded like gobbledygook – I agree that it does. That’s why you should let our EMIS watch for it! With an EMIS implementation including FDD, our scripts will be looking at your data 24/7, and will let us (or you) know when they see something weird.
Our Technology Stack
Sounds awesome! How are we doing this?
The Data Pipeline
The first step is establishing the data pipeline. There are a few possible ways to set this up, so I’ve listed three below. The bottom line is that our system architecture is flexible, and we’re willing to meet you and your IT/OT team where you’re at.
- Do you already store your data on a Brick or Haystack server on-site? Can we pull data from it over API? And, are you tracking all the energy drivers? If yes to all three, we’re off to the races.
That last question – the tracking of the energy drivers – is the biggest caveat. Time and again we find BMS implementations that, regrettably, don’t include energy consumption tracking on major equipment. This is one of the more common issues we catch in submittal review of a controls submittal: the project specifications call for kW monitoring on, for example, a chiller plant (meaning the owner wants to track electrical consumption), but the engineers approve a sequence without kW tracking. Maybe it’s the first thing that gets value engineered away. For most buildings, an EMIS worth its weight needs to monitor energy consumption of central heating and cooling systems. If we’re starting an EMIS implementation in a building where these systems’ power consumption values are not being monitored, we’ll need to go to point #3 below. - Maybe your BMS is already tracking all the right points including the energy drivers, and we just need to get them out of your building and into our EMIS. In this case, we’d partner with our friends at ACE IoT Solutions to deploy an “edge node” on your building’s network to send your BMS data into our database. ACE’s platform is outbound-only, meaning your IT department doesn’t need to do any “allow-listing” for new incoming connections. Instead, we would deploy ACE’s node inside your building, it would find the points and any metadata automatically, and then send it out through a secure connection.
ACE’s edge node is, above all, highly interoperable. Whether your building uses BACnet, Modbus, MQTT, LoRaWAN, oBIX, or some other data transfer protocol, ACE scoops it up into an Independent Data Layer (IDL). From there, it’s open season on data analytics.
But similar to the caveat listed in #1, this won’t bring us data points that you aren’t physically monitoring. So if you’re not monitoring all the energy drivers we’d want to see in an EMIS, we’d roll up our sleeves and install some electrical submetering (#3, next point). - If your BAS isn’t tracking the electricity usage of your building’s primary energy drivers, then we’ll want to go in and install additional hardware. We’d use something like an eGauge, which is sort of a 3-in-1 device: energy meter, data logger, and server all in one. Using an eGauge hooked up to a local network (or even a cell modem), we can finally get all the data we need from your building.
Most likely, we’d need to do a combination of #2 and #3 in your building. We are definitely solutions-oriented here—we share your interest in taking the least complicated and most cost-effective path.
Once the data pipeline is built, we can get to the fun part.
Dashboarding and Analytics
Our EMIS is built almost entirely in Python, which has become the most popular programming language in the STEM community. Python’s machine learning modules are used widely in academia as well as for predictive analytics by companies like J. P. Morgan and Spotify. It is an open-source language – meaning the language is non-proprietary, many thousands of developers from all over the world (now including Cx Associates) contribute to its code base, and developers can pull this code into their own academic or commercial applications – and our EMIS has already incorporated modules such as Psychrolib, the Project Haystack schema, and the Brick schema. Why reinvent the wheel when we can stand on the shoulders of giants?
It used to be that in order to build a web application, you needed to know languages like JavaScript or HTML or CSS. All of those are web scripting languages with generally different use cases than you might see for Python, so why would an engineer need to know them? Hence, mechanical engineers didn’t have the skills to deploy web applications.
But then in the last five years or so, tools have emerged that short-circuit many of the formalities of scripting and hosting web apps, allowing us to build dashboards in pure Python and leave the web hosting aspects to web experts and commercial services.
As a result, the same Cx engineer who runs tests on your air handling unit can build your energy dashboard. This brings me back to the highly integrated aspect of commissioning work. Our EMIS is better because it was built by energy managers, for energy managers. We build the things we want to see in a building. And we can build the things you want to see as well.
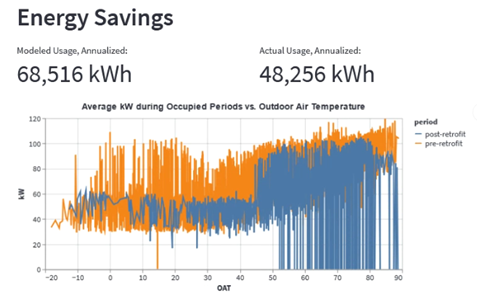
Another EMIS excerpt, this one showing a building’s energy usage (y-axis) over a range of outdoor air temperatures (x-axis). The orange is from before retrocommissioning, and the blue is from after.
Programmer as Studio Producer
My favorite part of developing Cx Associates’ EMIS has been distilling our time-tested engineering analysis expertise into code. If you could spend a Monday afternoon at our office, you might hear a senior engineer explaining to a colleague something like, “You watch the discharge air temperature for an hour and you know that if it doesn’t change, your outdoor air reset has probably faulted.” On some level, that sentence probably makes more sense in Python than in English. It should be a computer program’s job to watch these things, and the rest of us should be freed up to read the reports and make changes to sequences.
Working with engineers and contractor partners, I realize that all of us think in code-like ways. We all have similar but ultimately unique approaches to diagnosing and troubleshooting problems. I find myself compelled to get these approaches coded into Python. That way, all we have to do is import them into various implementations. What’s needed is adoption, implementation, and increased competency in frameworks that ensure persistence of these monitoring functions that – I think we agree here! -- need to be implemented in order to fully realize energy savings and ensure buildings are performing as efficiently as possible.