The Environmental Protection Agency's (EPA) Energy Star program for commercial buildings provides a system for benchmarking buildings across the country, and across different building use types. Buildings can be entered into the system by using the Energy Star’s Portfolio Manager, an online tool that can be used to track and measure energy and water consumption, in addition to associated greenhouse gas emissions.
How it works
When buildings have been entered into the program, the building is assigned a score of 1 to 100 based upon its energy performance. A challenge in comparing buildings equitably is that some energy sources require more energy to produce, store, and deliver than others. For example, for 2013, the EPA estimates that 100,000 BTUs of electrical energy used, say, to heat hot water in a school required a total of 314,000 BTUs of source energy. The 214,000 BTU difference accounts for electrical transmission losses and the efficiency of a typical power plant. In comparison, according to the same EPA statistics, the same 100,000 BTUs of energy used to heat hot water with natural gas would require 105,000 BTUs of source energy—in other words, 5,000 BTUs of energy associated with production and delivery. Incidentally, this astonishing difference in “overhead” associated with electricity is one of the many reasons that heating with electrical resistance heater is a bad idea.
To develop these ratios, the EPA averages source-to-site ratios throughout the country for different energy types. The following table presents the EPA’s source-to-site ratios, which reflect a 2013 update:
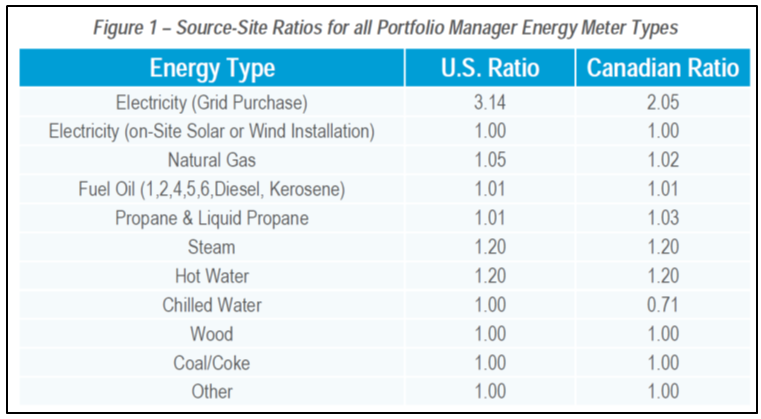 Figure 1 - Excerpted from Energy Star Portfolio Manager Technical Reference
A missing component
While the ratios used to convert from source to site energy include all the energy associated with efficiency of generation, as well as transmission and delivery losses, they do not account for efficiencies in raw fuel production. In the case of some fuels (such as tar sands oil production), this can be a large missing component. Further, because the ratios are national averages, they do not account for regional variations in electricity production portfolios—in some areas of the country, the fuel mix in energy production is largely coal based. For example, according the US Energy Information Administration, the fuel mix for electricity production in Kansas is nearly 57% coal. Here in Vermont, there is 0% of generation by coal, and lots of hydropower and nuclear (though because of an interconnected grid, a small portion of Vermont’s power consumed is derived from coal). While the lifecycle energy costs associated with various fuel types and different electrical energy source mixes is an important consideration, the EPA has determined that it should not be taken into consideration when benchmarking buildings nationally. I agree that this approach probably makes sense for the purpose of the national rating system, but knowing these other pieces of information is also important—ideally this information would be available through Portfolio Manager, even though it is not used for the index.
 Coal Power Plant (Photo credit: nino63004)
This kind of information would be useful to know, because in the long term it may make sense to locate more energy intensive activities in locations where power/fuel production has the least impact in terms of greenhouse gas emissions. We mostly take for granted now that in many cases, industry can be sited generally where it is convenient for operation (near transportation routes, population centers, etc.). But back when electrical energy generation and distribution was much more constrained, large industrial customers were forced to locate their operations near energy sources. This is one reason, for example, that certain energy intensive industries such as chemical, steel, and manufacturing operations ended up near Niagara Falls, where in the late 1800’s the first hydroelectric generating stations were installed.
Understand your building's score
For now, and given the current system, whether you are a building owner or energy efficiency professional, knowing the difference between site energy and source energy is helpful in understanding how your building’s score is developed. To learn more detail and background about the way EPA develops the source to site ratios, I recommend checking out the Energy Star Portfolio Manager Source Energy Technical Reference (PDF) document.