There are many opportunities to improve computer datacenter energy performance, whether you’re operating a small server closet, or a large datacenter in a Fortune 1,000 company. But the key to tackling energy use in datacenters is measuring and tracking energy performance over time. Relevant measurement of energy performance over time is feasible now, but that has not always been the case.
Moore’s Law and Koomey’s Law
In the mid 1960’s, Intel cofounder Gordon Moore predicted that the number of transistors that can be cost effectively fit on a computer chip doubles approximately every 18 months. This predicted trend, known as “Moore’s Law”, has proved remarkably accurate and associated computer capabilities have tracked closely to this trajectory of growth, even to this day. This rule of thumb for growth applies to computational speeds as well as memory capacities—and anyone who has purchased flash memory for say, a digital camera, in the past decade knows this price-per-capacity over time relationship to be experientially true; a 1 gigabyte flash card that could be purchased for $100 in the mid-2000’s is nearly free today.
So what relationship does this rapid growth in compute capacity have on trends in computer energy efficiency? Historically—and especially in the past few decades with the increasing transition to mobile computing platforms, such as handhelds and laptops—market-driven energy efficiency concerns have been as important as processor speed. The industry quickly found that fast and powerful mobile hardware (e.g., smartphones, laptops) with a huge energy footprint will not sell if they only have a few hours of battery life. And it turns out that historically, a relationship remarkably similar to Moore’s Law has held for the relationship between processor capacity and energy consumption. According to research by consulting professor Jonathan Koomey of Stanford University, for a fixed computational load, energy use has declined by 50% every 18 months — a trend that holds historically true back to some of the first computing hardware in the 1940’s. Others have dubbed this “Koomey’s Law,” though Koomey has not.
Where is the Return?
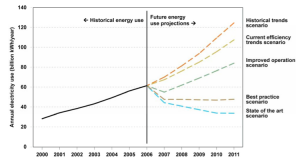
Despite these drastic improvements in raw compute efficiency, impacts of this trend on datacenter energy consumption have been slow to materialize. In a 2007 EPA report to congress examining datacenter energy use[1], researchers (led by Koomey’s work) reported that US datacenter energy requirements had more than doubled in the period between 2000 and 2006. Based on this trend, the report projected another doubling in datacenter energy use by 2011—with an annual energy use estimate of 100 billion kWh, and a peak demand of 12 gigawatts. To put this peak demand in perspective, the nation’s largest baseload nuclear power plant, Palo Verde, operated by Arizona Public Service, is rated at 3.3 GW. Figure 1, below is a graph that presents historical and projected datacenter energy use, as presented in the 2007 report to congress.[2]
In an updated examination of these datacenter energy use trends[3], commissioned in 2011 by the New York Times, Koomey found that these 2007 projections were overestimates—rather than more than doubling datacenter energy use, the increase in the US was only 36%, and only 53% worldwide. The reasons for this lower-than-projected increase in energy use are several-fold, though interestingly, increased compute efficiency was not the leading factor. Instead, the economic slowdown, as well as increased server utilization (more work done by the same number of servers) were likely the primary drivers. In fact, during this period, energy use per server continued to increase, but through improvements in virtualization—or running multiple software instances of a server on a single physical server—server utilization rates were able to be increased significantly, thereby reducing the comparative effects of underutilized server standby losses.
Start With Performance Metrics
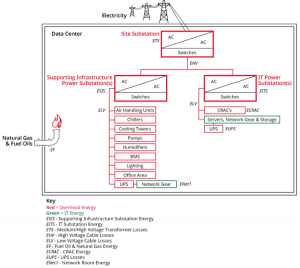
Despite the macro trends in datacenter energy use, most facilities operators are likely to see a continued and significant increase in energy requirements for datacenters, though with that said, most facility managers (other than large-scale datacenter operators) may not even know how their energy performance has trended, due to a lack of data—often the only information to work with is that provided by the “house” power meter. Additionally, tracking datacenter energy performance can be difficult—largely because the datacenter is comprised of a set of systems: HVAC systems (cooling), networking hardware, lighting, humidity control, uninterruptable power supplies, and more—all of which affect performance and have interactive effects. Plus there is the question of “what do I measure, and how?” In an effort to create standard performance metrics across the industry, The Green Grid, an industry nonprofit, was created to establish standards[4]. The metric which they advocate using (which is the industry-accepted metric at this time) is Power Usage Effectiveness (PUE). The PUE is the ratio of the total site power (computing plus overhead facility power) to computing hardware power. There is some variation in where the “boundary” lines are drawn in this calculation, and The Green Grid, as an industry organization, provides a looser definition of these boundaries. Figure 2, below, depicts Google’s version of what is included in the calculation, and is more consistent with Koomey’s level of rigor in his 2008 report, The Science of Measurement: Improving Data Center Performance with Continuous Monitoring and Measurement of Site Infrastructure[5].[6]
Estimates for PUE values for US datacenters were between 1.83 and 1.92[7] — in other words, for each kWh used by datacenter hardware, between 0.83 and 0.92 kWh were used for supporting systems. For large scale “cloud” datacenters, such as those operated by Amazon, Google, IBM, etc—a tremendous amount of effort has been expended on optimization and efficiency. As a result, they are currently self-reporting PUMs as low as 1.19. These efficiencies are possible because the compute and energy densities allow for very fast payback for measures to improve performance.
Conclusion
There are many opportunities to improve datacenter energy performance, whether you’re operating a small server closet, or a large datacenter in a Fortune 1,000 company — many IT-side approaches exist to improve server utilization, new, more efficient server equipment enters the market all the time, and new standards from ASHRAE (the American Society of Heating and Refrigeration Engineers) provide updated guidance on optimizing cooling and other HVAC efficiency for datacenters. And all of these approaches will be examined in more detail in future blog posts. However, the most important first step in tracking energy use in datacenters is measuring and tracking energy performance over time. In fact, this approach in general is one that we strongly advocate to our clients in many areas of building operations—without data, making smart and effective decisions to improve performance (and reduce cost) are difficult, if not impossible.


